
称重传感器疲劳理论

Background
Interface has specialized in fatigue-rated load cells and their applications since its founding in 1968. Fatigue rating is a distinct specification which guarantees the customer a load cell which has a service life of 100 million fully reversed loading cycles at full rated capacity.
The very first products at Interface were fatigue-rated load cells, and over the years a history has been built up by thousands of cells in use all over the world. Many have been supplied to major manufacturers of materials test machines and to major aerospace manufacturers, for use in long term structural fatigue test programs on aircraft, space, and automotive equipment. No fatigue failure of any fatigue-rated Interface load cell, used within its ratings, has ever been reported.
Fatigue Failure Theory
It is well known that metals will fail in a statically loaded situation if the yield strength is exceeded. Inasmuch as load cells are structural members which are stressed in the course of their normal use, they are commonly given ultimate overload ratings in an effort to characterize the magnitude of static load they will withstand without failing structurally.
However, all metal structures, including load cells, are also subject to failure as a result of repetitive loadings which are much lower than the ultimate overload rating. This phenomenon is known as a fatigue failure, and it is due to the fact that the stress which a metal can withstand under cyclic loading usually becomes less and less as the number of cyclic loadings is increased.
The cause of this apparent anomaly can be explained by noting that metals are typically not perfectly homogeneous solids. They are composed of crystals, and at locations called grain boundaries, along slip planes or in a region of a microscopic defect there can be minute strains under load which do not completely reverse during unload, leaving the material with a slight plastic deformation at the end of each complete cycle. This effect is highly dependent on the magnitude of the load and the number of cycles.
Anatomy of a Fatigue Failure
It is generally acknowledged that a structural fatigue failure develops in three stages:
- Repeated cycling builds up local plastic deformation, and a microscopic crack is initiated.
- The crack propagates and a larger section becomes weakened.
- Stress concentration in the section of cracking increases rapidly, and continued cycling enlarges the crack until sudden fracture occurs.
Fatigue Life Prediction
Accurate prediction of fatigue life of any structure is not a reality. Well controlled tests on the most simple configurations of test specimens result in a wide scatter band of results. With complex structures typical of a load cell, analysis is even more complex. Theoretical analysis can produce approximations, however, which can be useful in estimating the margin of safety at which a particular load cell design is operating.
In materials science, the S-N curve is a well known tool. It is a graphical representation of the number of load cycles required to break a specimen, at a range of peak cyclic stress levels. S-N curves for the high quality materials used in Interface load cells have been experimentally determined, and are shown in Figure 1 for stainless steel and alloy steel, and in Figure 2 for aluminum alloy.
Thus, if the stress level is known, the fatigue life can be approximately known. However, there are factors which make fatigue life difficult to characterize.
Load Cell Fatigue Failure Modes
Components Subject to Failure
There are two metal components in a load cell that must be considered in fatigue analysis, the flexure (spring element) and the strain gage (sensor).
- The flexure bears the load; therefore failure of the flexure is structural.
- Since the gages function is electrical measurement of minute deflections, failure of the strain gages, on the other hand, is typically not structural; failure is noted by a shift in resistance or gage factor.
The relative propensity to first encounter flexure or strain gage fatigue failure depends upon the design of the transducer.
Flexures
There are several metals used for flexures in Interface load cells including aircraft quality alloy steel, stainless steel, and high strength fatigue-resistant aluminum alloy. S-N curves for these three materials are presented in Figure 1 and Figure 2.
Stress is normally expressed in units of psi (pounds per square inch), but for convenience we use units of Ksi which are equal to 1000 psi. Shear stress is on the vertical axis, corresponding to the state of stress in Low Profile load cells. Readers with some materials science familiarity will recognize that classical fatigue strength for these materials is higher than indicated in the figures. This is because classical data is for bending or direct stress, whereas Interface fatigue-rated cells operate in shear mode. This analysis therefore appropriately uses the required factor for shear, avoiding a falsely optimistic result.
Note that the shear S-N curve for steel becomes essentially flat at about 55 KSI. This is a characteristic of steel. The stress level at the flat portion of the curve is called the endurance limit. If operated below this limit, theoretically the material will endure an infinite number of load cycles. Nonferrous metals do not generally exhibit an endurance limit, their curves continuing on with a small slope.
Gages
Interface strain gages are specially made of fatigue-resistant nickel-chromium alloy. Strain gage fatigue characteristics are most conveniently viewed in terms of strain rather than stress. Figure 3 shows a Strain-N curve for Interface strain gage material. Strain is a dimensionless quantity of normally very small magnitude. The microstrain unit is simply 106 strain units and is used for convenience. Stress and strain for any particular material are related by a constant which is the modulus of elasticity (30X106 for steel and 10X106 for aluminum), allowing convenient comparison of S-N curves and Strain-N curves.
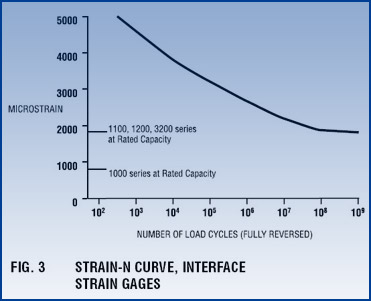
NOTE: The curves in Figures 1, 2, and 3 are for fully reversed load cycles, meaning that for 2000 microstrain as an example, a cycle starts at zero load and consists of one load to (+2000), one load to (-2000), with a return to zero.
Comparison of Loading Levels
Superimposed on the curves are operating levels of Interface Low Profile load cells by model series. This provides a convenient visualization of the fact that all of these load cells are designed to have very long, if not infinite, theoretical fatigue lives. Remember that in actual practice things are not necessarily so ideal. Therefore, in order to establish the correlation between theoretical and realizable fatigue life, actual test results are desirable.
Design Verification Tests
Test Protocol
Interface conducted Design Verification Tests to substantiate the theoretical life predictions by means of actual load tests of the product. Obviously, building up millions of load cycles on a high capacity load cell is not a trivial task. Many hours of costly machine time are required. Tests were conducted on three representative Interface Low Profile load cells: (1) an aluminum cell of 5,500 lbf capacity, (2) a steel cell of 11,000 lbf capacity, and (3) a steel cell of 22,000 lbf capacity.
Loading to 130% of rating was selected as an acceleration factor, to bring down the test time to a realizable length, since 100 million cycles at 1 hertz and 100% loading would consume 3 years and 2 months of testing, 24 hours per day. Based on the slopes of the S-N curves, a cycle acceleration factor of at least 10 can be achieved with 130% loading, thus ensuring that the more stringent test at 107 cycles will prove a fatigue life of 108 cycles at 100% loading.
Test Results
Analysis of the test data showed that there were no indications of fatigue failure nor degradation of load cell performance outside specified limits, for the critical load cell parameters of output, zero balance, nonlinearity, hysteresis, and creep, during or after completion of the Verification Test program.
Benefits of Reduced Stress Levels
Lower Stress by Design
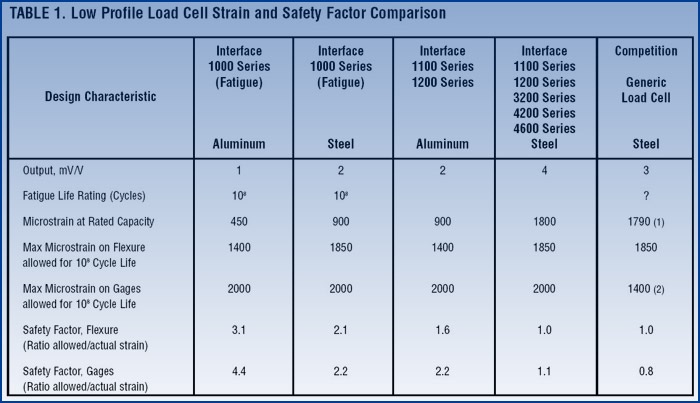
Interface load cells are designed for optimum fatigue life. Other load cells are not necessarily equivalent. Table 1 below is a comparison of actual strain levels in Low Profile™ and typical competitive load cells. The safety factors are a means of visualizing the design merit of the various designs. The value of fatigue rated load cells for fatigue applications is evident from the safety factor data. It is also apparent that Interface load cells with 4 mV/V output have lower stress levels and, therefore, more fatigue resistance than competitors' cells, even though their output is only 3 mV/V or less.
Lower Stress by User Limits
Note that the tests and S-N curves are based on fully reversed load cycles. This type of loading cycle is considerably more stringent than unidirectional loading, which is the more common application of load cells. If a fatigue load cell is repeatedly loaded in only one direction, the Goodman Law predicts that it can be loaded to about 133% of the bidirectional fatigue-rated capacity with no degradation of its fatigue rating. Conversely, unidirectional loading to a fatigue cell's rated capacity is much less stressful on the cell than bidirectional loading and can be expected to yield a fatigue life well beyond the number of cycles which could be reasonably and economically applied in a verification test program.
NOTE:
- In typical competitors' load cells, the copper-nickel alloy gages have approximately 20% lower Gage Factor than Interface gages and lose approximately 10% of their natural output to temperature compensation circuitry, a loss which is not present with Interface self-compensated gages. The result is that generic 3 mV/V load cells are stressed about equally with Interface 4 mV/V load cells.
- Typical copper-nickel alloy gages have approximately 70% of the fatigue resistance of Interface nickel-chromium alloy gages.
